Crow Canyon Software Forum
Grouping SharePoint List Data by Columns rather than Items in a Report
Quote from pf-amalin on March 20, 2025, 5:10 pmHey everyone,
I’m not sure if this is possible, but I wanted to throw it out there and see if anyone has ideas. I need something similar to a Pivot Table for SharePoint list items.
We have a SharePoint list used as a questionnaire for Department Heads. Each item includes columns for [Department], [Department Head], and multiple question fields ([Question 1], [Question 2], etc.). The list works well with NITRO Forms, but I’m struggling with how to generate a report that groups responses by Question rather than by Item.
Desired Output Format:
Instead of listing responses row by row, I need to group by question, showing all department responses before moving on to the next question:
[Question 1 Description]
[Department], [Dept Head]
Response from Department A[Department], [Dept Head]
Response from Department Betc...
[Question 2 Description]
[Department], [Dept Head]
Response from Department A[Department], [Dept Head]
Response from Department Betc...
…and so on through the last question.
Additional Challenge:
Rather than displaying the column name, I want to use the column description since that field contains the full question text.
Has anyone tackled something like this before? Any ideas on how to approach it using NITRO Forms, Reports, Views, or something else? Appreciate any insights!
Hey everyone,
I’m not sure if this is possible, but I wanted to throw it out there and see if anyone has ideas. I need something similar to a Pivot Table for SharePoint list items.
We have a SharePoint list used as a questionnaire for Department Heads. Each item includes columns for [Department], [Department Head], and multiple question fields ([Question 1], [Question 2], etc.). The list works well with NITRO Forms, but I’m struggling with how to generate a report that groups responses by Question rather than by Item.
Desired Output Format:
Instead of listing responses row by row, I need to group by question, showing all department responses before moving on to the next question:
[Question 1 Description]
[Department], [Dept Head]
Response from Department A
[Department], [Dept Head]
Response from Department B
etc...
[Question 2 Description]
[Department], [Dept Head]
Response from Department A
[Department], [Dept Head]
Response from Department B
etc...
…and so on through the last question.
Additional Challenge:
Rather than displaying the column name, I want to use the column description since that field contains the full question text.
Quote from supportTeam on March 25, 2025, 10:48 amHi Art,
You can configure a NITRO List view and configure groupings for the specific view used to group by the 'Question' column,
Go to NITRO List View Settings.
In the General section, add a new view and edit it.
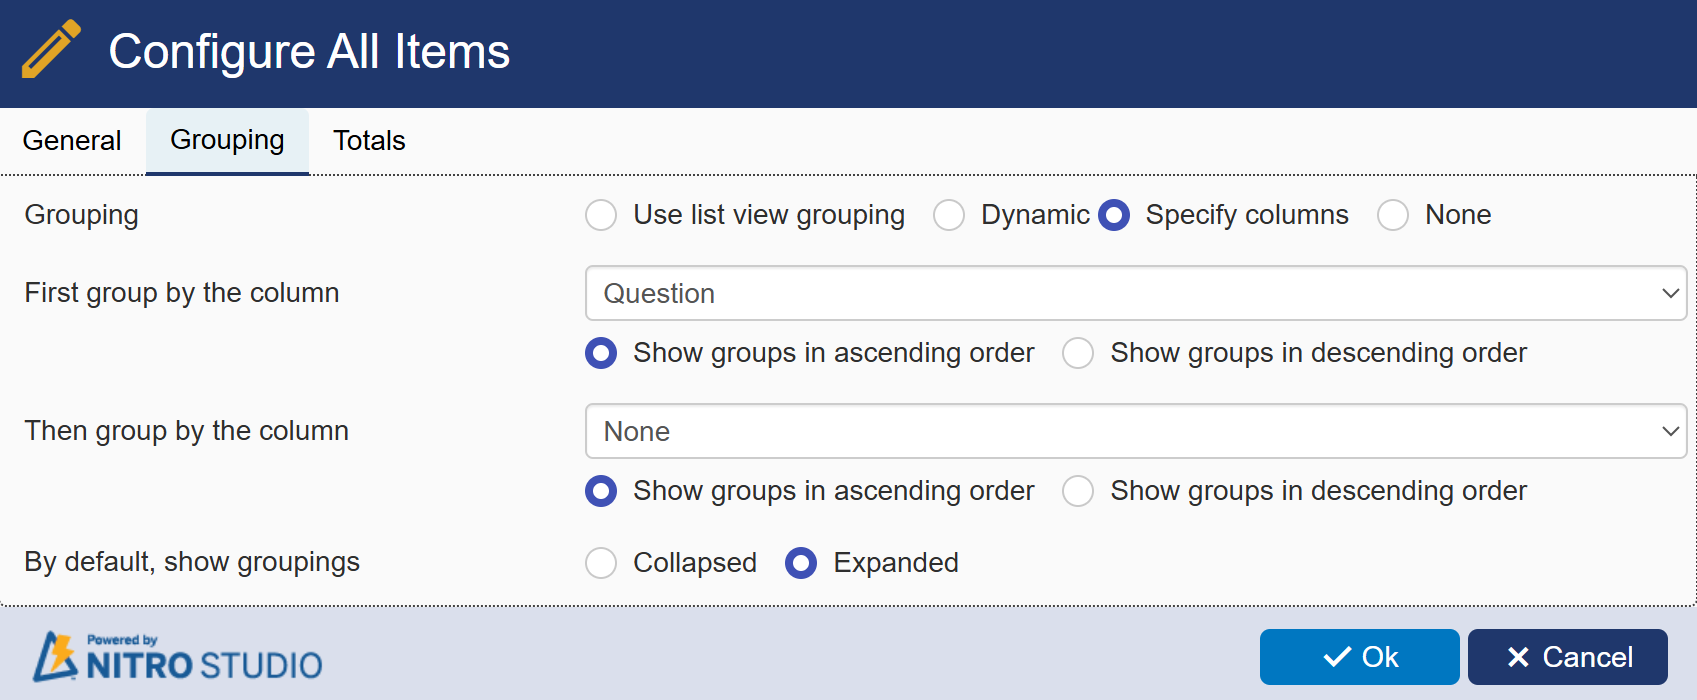
Click on the Grouping section and configure it as shown in the attachment.
Save the NITRO List view and navigate back to the page.
Click on Export to Excel and check the results.
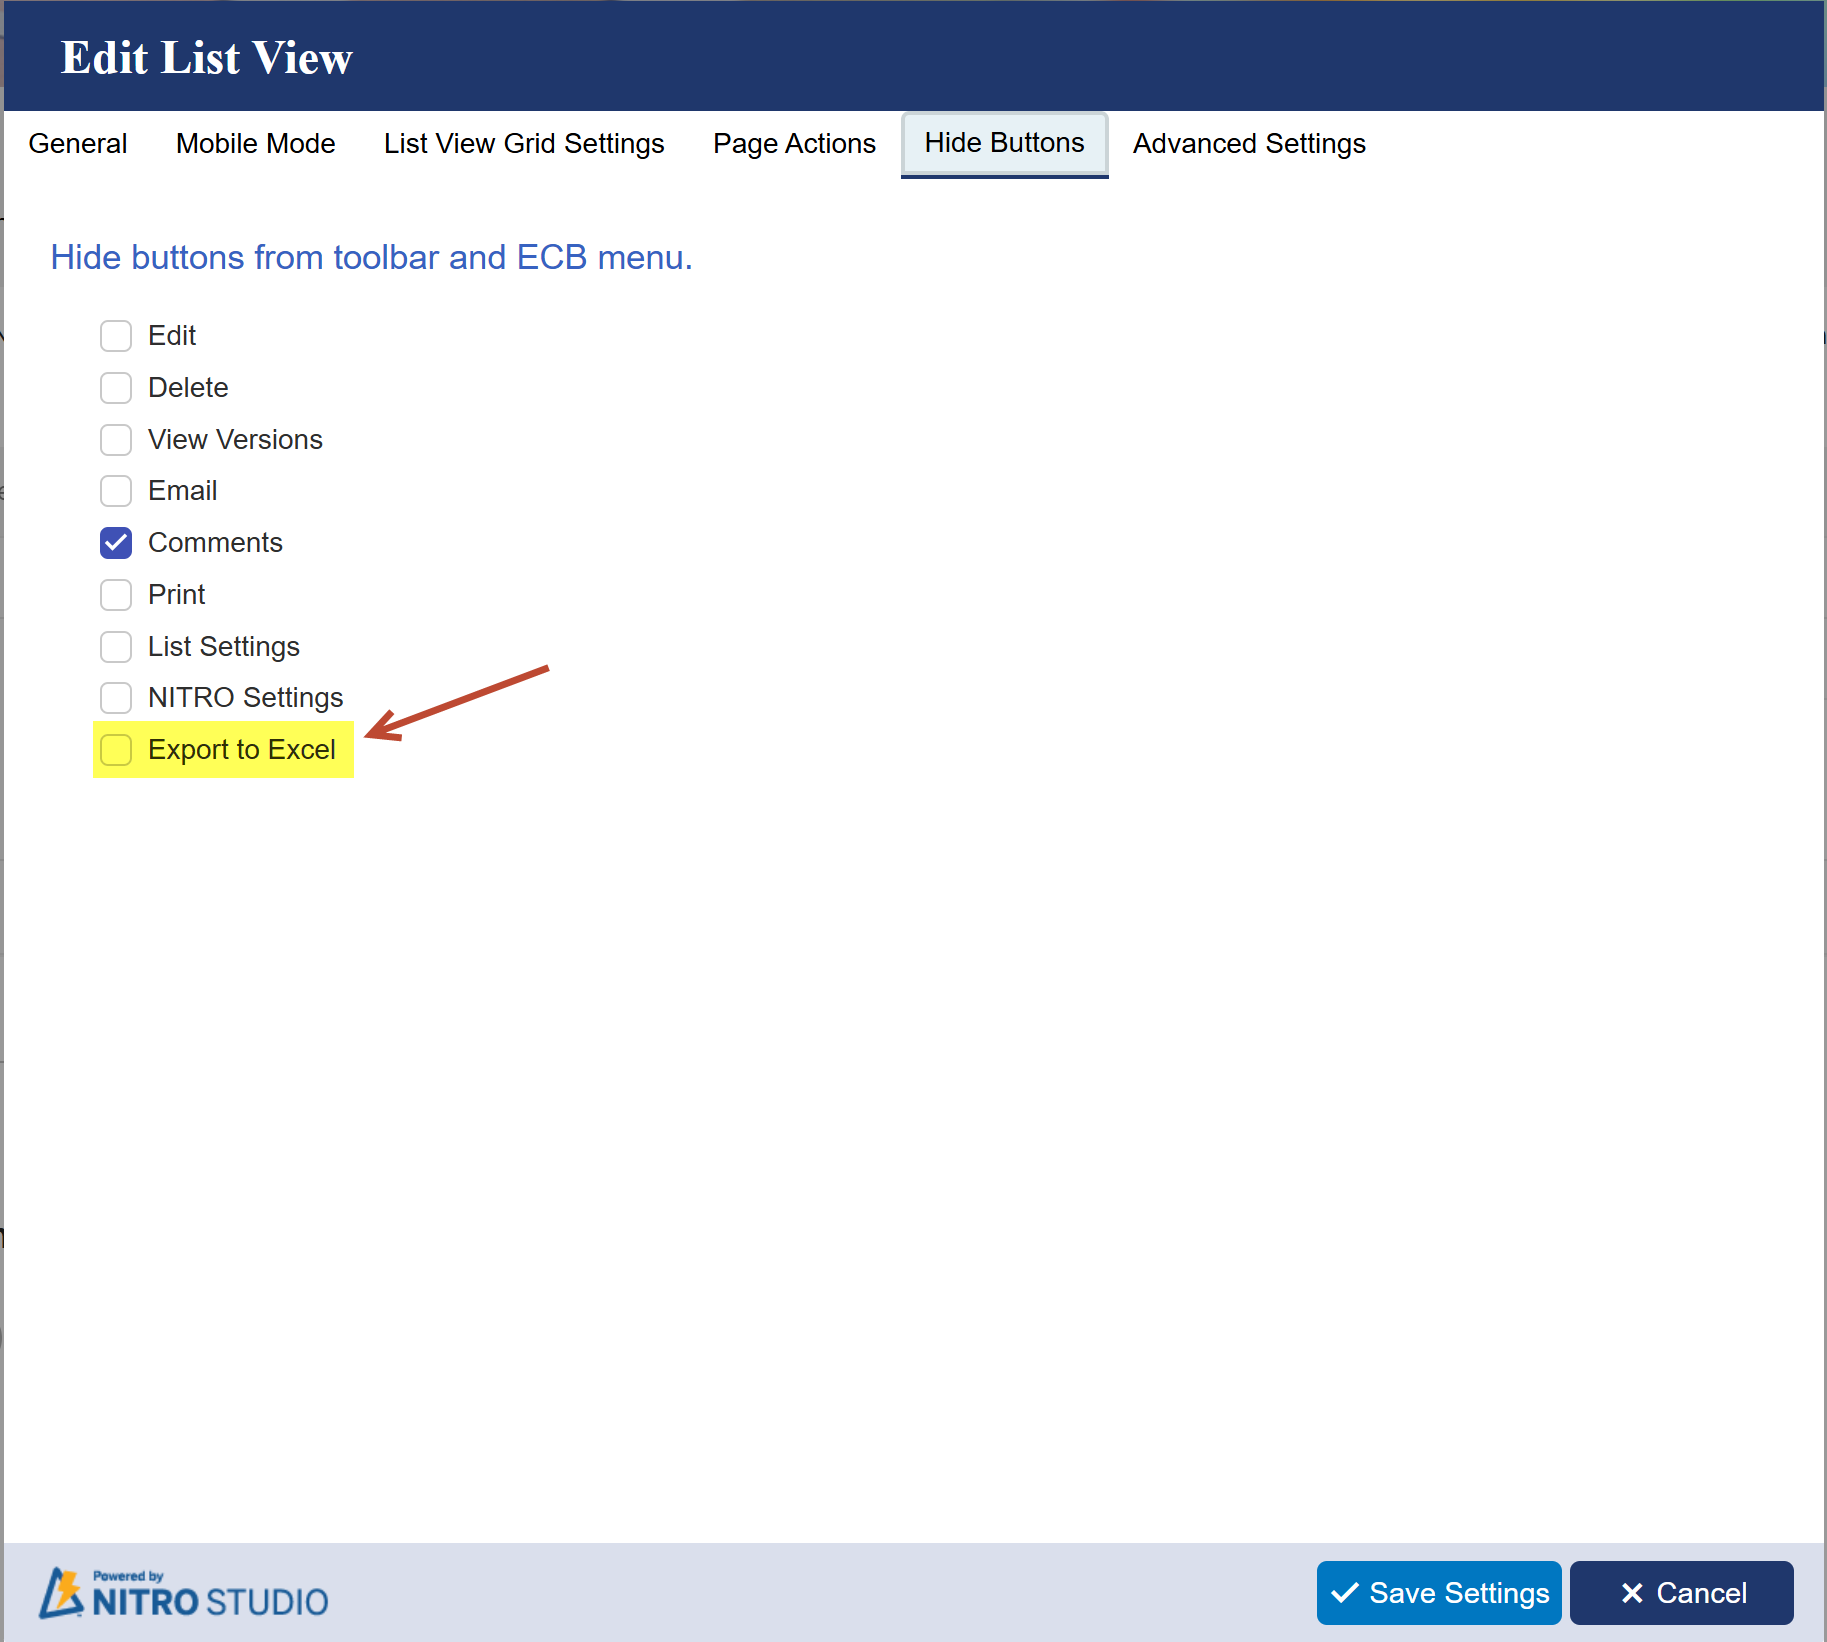
If the Export to Excel button is not visible in the NITRO List view, go to the Hide Buttons section and make sure the Export to Excel button is shown.
Hi Art,
You can configure a NITRO List view and configure groupings for the specific view used to group by the 'Question' column,
-
Go to NITRO List View Settings.
-
In the General section, add a new view and edit it.
-
Click on the Grouping section and configure it as shown in the attachment.
-
Save the NITRO List view and navigate back to the page.
-
Click on Export to Excel and check the results.
-
If the Export to Excel button is not visible in the NITRO List view, go to the Hide Buttons section and make sure the Export to Excel button is shown.
-
Quote from pf-amalin on March 26, 2025, 12:58 pmThe suggested approach behaves like standard SharePoint grouping, which isn't what I need. Each item in my list has answers for multiple question columns, and I need to restructure the data so that each question column (for example, New Expenses, Challenges, Staffing) becomes its own group, listing the department alongside the relevant answer for that question.
Standard grouping would group by a single column's values, but I need to display data from multiple columns in separate grouped sections. Think of it like pivoting the data:
- New Expenses (Group)
- Dept A: Answer
- Dept B: Answer
- Dept C: Answer
- Challenges (Group)
- Dept A: Answer
- Dept B: Answer
- Dept C: Answer
- Staffing (Group)
- Dept A: Answer
- Dept B: Answer
- Dept C: Answer
Each of the 10 question columns should have its own section, rather than grouping everything under one shared view. Any ideas for achieving this in SharePoint?
The suggested approach behaves like standard SharePoint grouping, which isn't what I need. Each item in my list has answers for multiple question columns, and I need to restructure the data so that each question column (for example, New Expenses, Challenges, Staffing) becomes its own group, listing the department alongside the relevant answer for that question.
Standard grouping would group by a single column's values, but I need to display data from multiple columns in separate grouped sections. Think of it like pivoting the data:
- New Expenses (Group)
- Dept A: Answer
- Dept B: Answer
- Dept C: Answer
- Challenges (Group)
- Dept A: Answer
- Dept B: Answer
- Dept C: Answer
- Staffing (Group)
- Dept A: Answer
- Dept B: Answer
- Dept C: Answer
Each of the 10 question columns should have its own section, rather than grouping everything under one shared view. Any ideas for achieving this in SharePoint?
Quote from supportTeam on March 28, 2025, 1:30 pmFor example, there are 20 departments, each with 10 questions, resulting in 200 items in the list. In SharePoint list view, only 20 items can be shown at once, but the requirement may exceed 200 items.
Additionally, some questions might not be answered and could have blank values. In a grouped SharePoint list view, only 20 items are shown, and displaying more isn’t directly possible.
Another option is to create a temporary list to track data based on updates to the existing list. This new list will have the question in the title column and store the department and answer in separate columns. Please let us know if this works.
For example, there are 20 departments, each with 10 questions, resulting in 200 items in the list. In SharePoint list view, only 20 items can be shown at once, but the requirement may exceed 200 items.
Additionally, some questions might not be answered and could have blank values. In a grouped SharePoint list view, only 20 items are shown, and displaying more isn’t directly possible.
Another option is to create a temporary list to track data based on updates to the existing list. This new list will have the question in the title column and store the department and answer in separate columns. Please let us know if this works.