Create Reports based on Survey data in Tickets List
Note: Before Configuring Reports on Survey data make sure that you have already copied Survey data to Tickets list. If not please refer this article: CopySurveyDataBackToTicket
Reports can be configured using standard SharePoint list views using Crow Canyon Report App.
Sample Report1: Survey Feedback on Tickets list
Report App takes the filtered view as input to show report on desired data, in this sample report, we are going to configure a report that shows the total number of “Satisfied” and “Not Satisfied” tickets in Column chart.
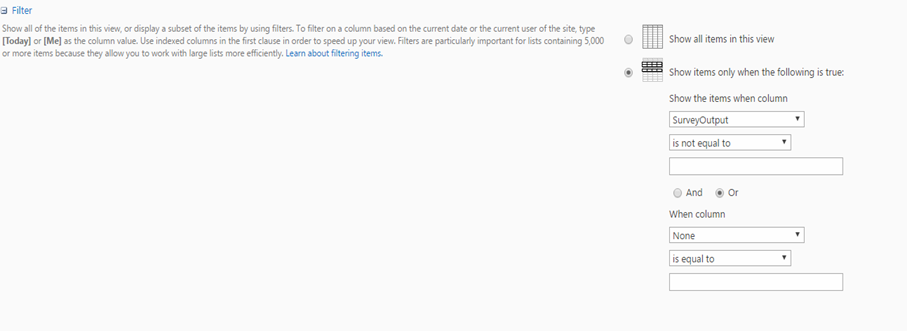
First, create a standard view in “Tickets” list. In this example, we name it as “Survey Feedback”
Go to List Settings – Create View – Select Standard View and configure filters to the view under Filter section as shown in the below picture.
Go to ‘Crow Canyon Charts, Dashboard and Reports App’, configure Report as shown in below screenshot

Sample Report2: Survey Feedback Count by Staff on Tickets list
Generate/Configure Report based on ‘Assigned Staff’ and ‘Survey Feedback’ as shown below


